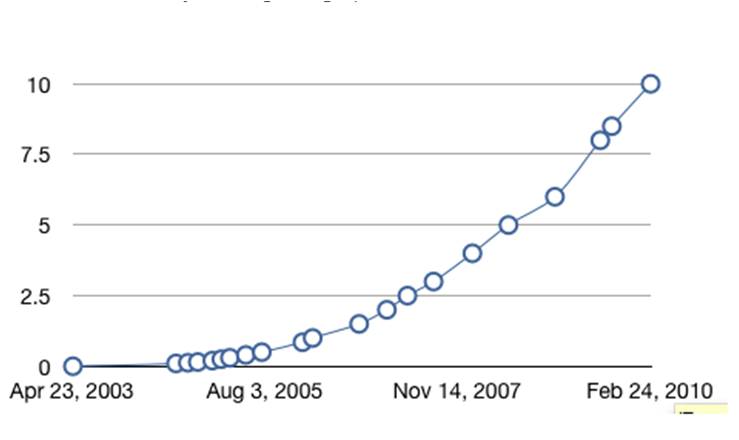

What type of function does this data appear to follow? -The graph appears to follow an exponential growth function. 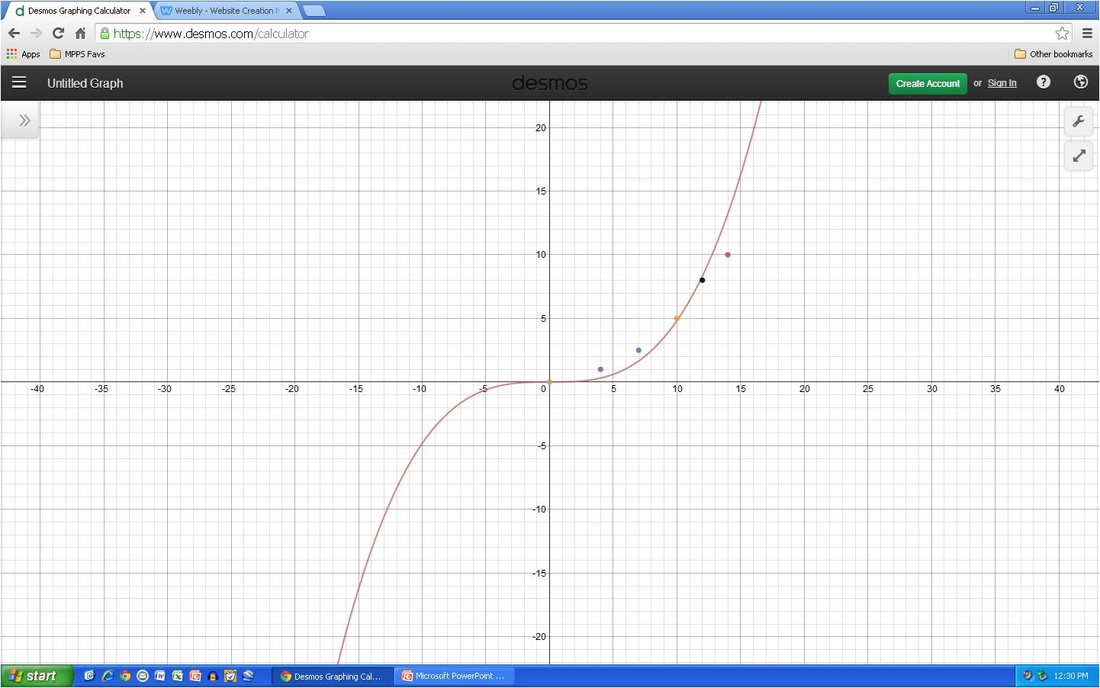
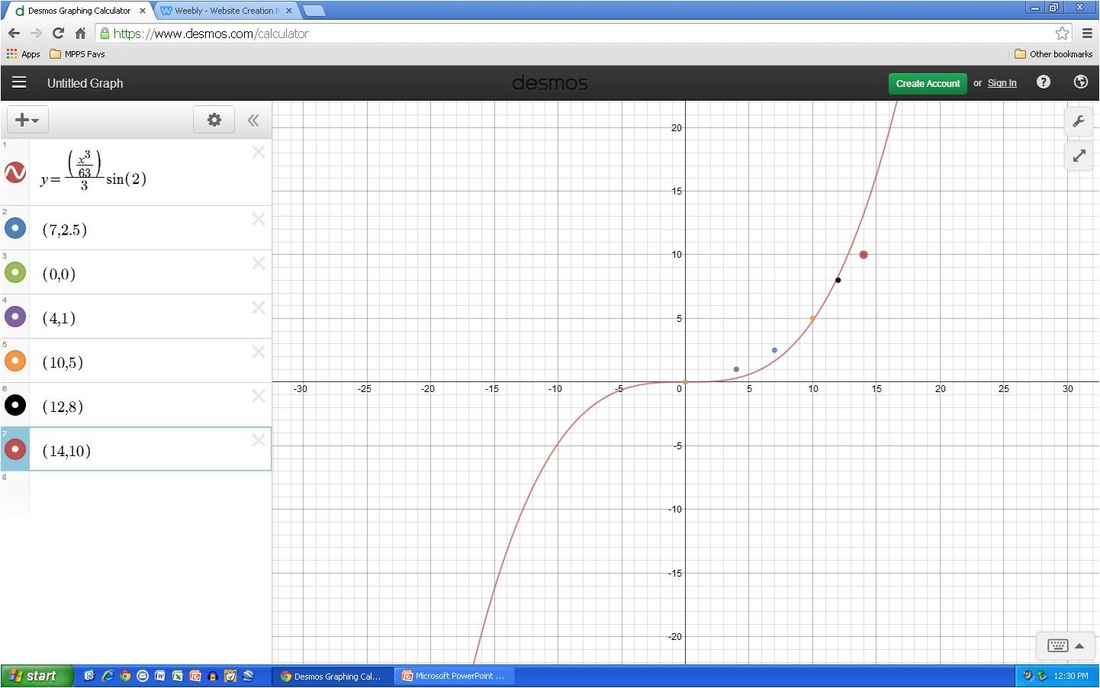
What is the domain of this function?
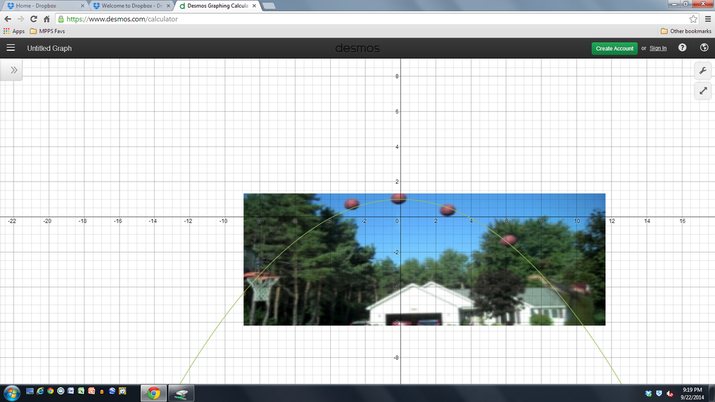
-The domain is [0, infinity) What is the range of this function? -The range is [0, infinity) The domain is all real numbers along with the range because the graph has the potential to be any positive number and zero. We ignore the negative numbers because you can not have negative songs sold. comment on the future shape of your mathematical model: -I think that the model will need to be changed because the article stated that the amount of music being downloaded has gone down and is projected to go down because of streaming services. If the plot points go down instead of continually going up, it would no longer be an exponential function. How does this affect your predictions of domain and range of the function? -The domain and range stay the same because in the real world you can not go back in time or sell negative of something. Is there a problem with trying to extend a set of data points to continuous functions? Why or why not? -There is a problem because the continuous function is if the plot points continued upwards, which is not happening because of the loss of sales for the Apple store. Using exponential growth, we assume that the plot points, or whatever we are tracking, will forever continue to grow. This is not the case in real life. Sales go up and down. I do believe the basketball will go in. My reasoning behind this is the trajectory shown in the graph. Using the equation below, I was able to get a very rough estimate on where the ball will go. Without factoring in wind, gravity, or drag, the graph shows the ball just past the hoop. Factoring the outside forces seperatly from the equation, I am making the assumption that the ball will end up slightly behind where the graph goes. 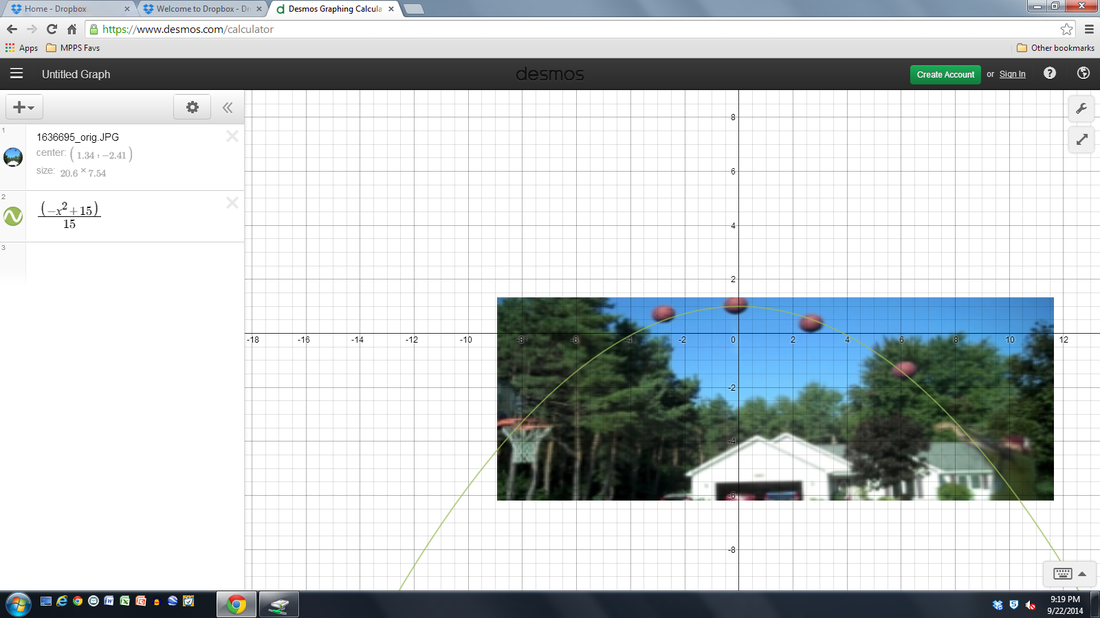
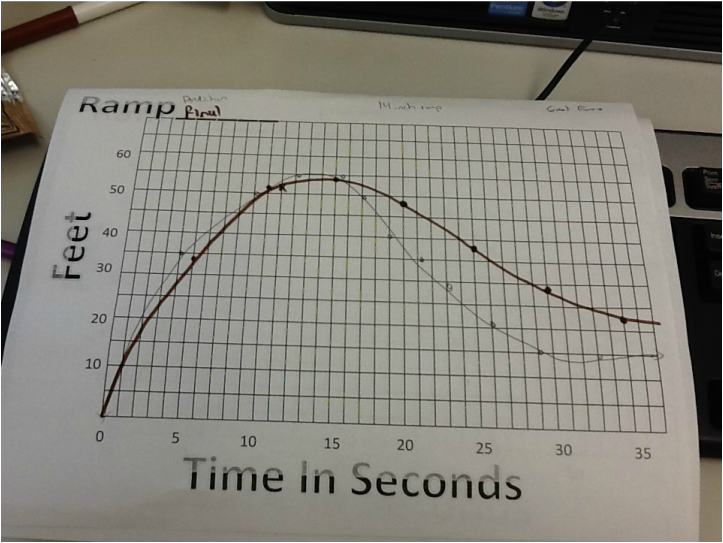
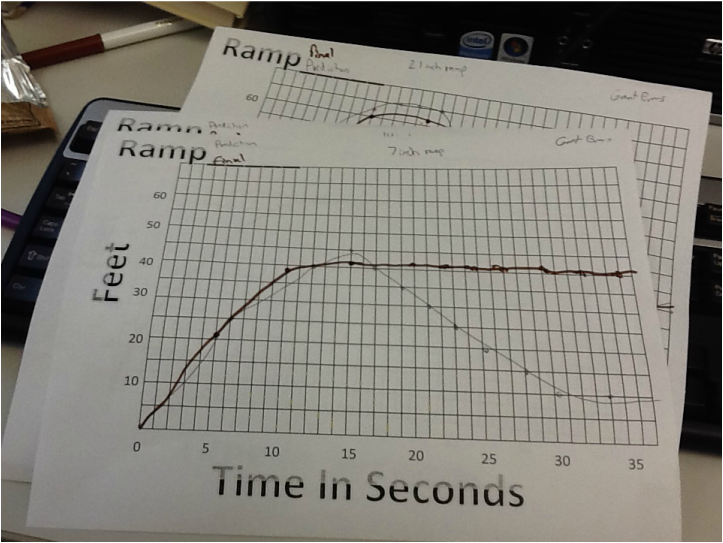
A. 2 of the 3 predictions I made were very close to the actual graph. The 7 inch ramp graph was close up until the tipping point of the graph. My prediction graph had the points move down to represent the skateboard move back towards the ramp, when in actuality, the skateboard stopped. The reasoning behind the prediction graphs was simple. I assumed that the skateboard would move away from the ramp at different speeds, depending on the angle of the ramp. So the higher the angle on the ramp, the steeper the graph on my predictions. B. The zeros represent the skateboard on top of the ramp, not moving. C. The zeros are all the same because the skateboard starts on top of the ramp all the time. The maxes are higher when the ramp angle is higher. On the 21 inch ramp, I thought in my prediction that the skateboard would create a new min by going back and then forwards again. The rate of acceleration is relatively the same. On the 7 inch ramp, the acceleration is slightly less so than the other two. D. When the graph is rising at its fastest, the skateboard is moving at the fastest rate of speed it will achieve. When the graph is falling at its fastest, it is moving backwards towards the ramp. E. 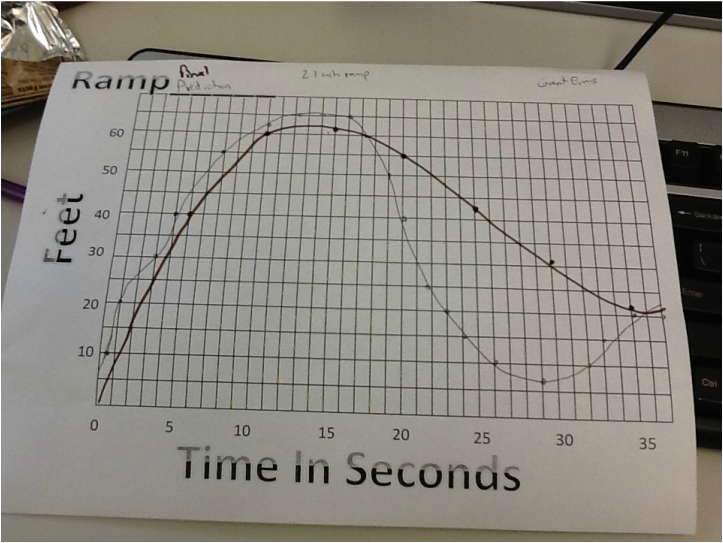
Graph a shows that the flag was raised at a constant rate of speed. Graph b shows that the speed at which the flag was raised was slowed down near the top. Graph c shows the flag stopping and moving in intervals. Graph d shows the flag gaining speed near the end. Graph e shows the flag gaining speed then losing speed. Graph f shows the flag going up the pole instantly. Graph c shows the raising of the flag most realistically because of the stop and go motion seen on the graph. Graph f is the most unrealistic because it is seemingly impossible to make the flag move up the pole instantly.
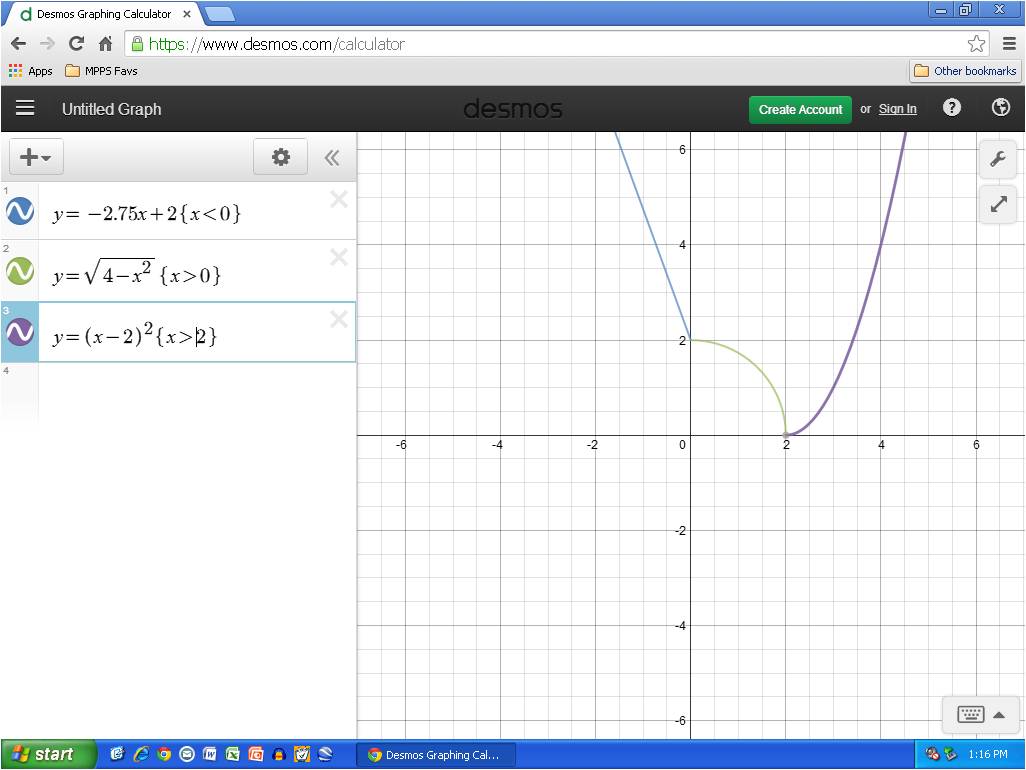
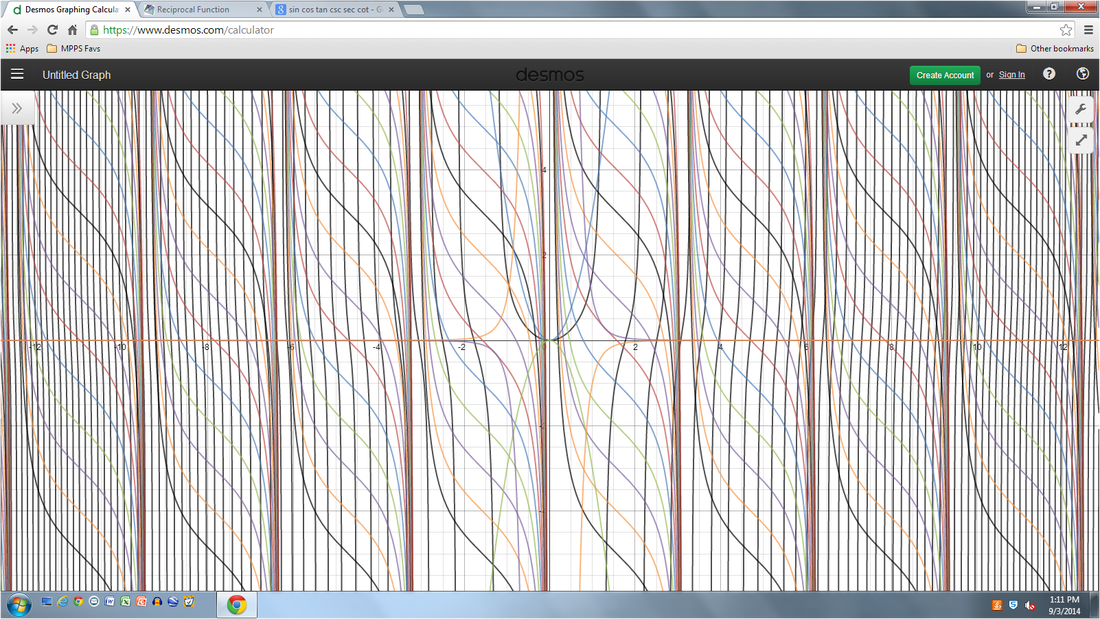 With the help of cotangent functions, I was able to make the cool spiral affect. Using Cotx+1,2,3,4,5, and ect., I created the spiral affect. I used a tangent exponential type of function to make the glitch affect. I also used reciprocal functions and exponential functions to touch it up a little. Using Cotx+1,2,3,4,5 and ect., I moved the graph up or down depending on if the number was negative or positive. If the function has a positive number, it will move up. If it is a negative number, it will move down.
| Grant EvansIt ain't easy, being cheesy. ArchivesFebruary 2015 Categories |
 RSS Feed