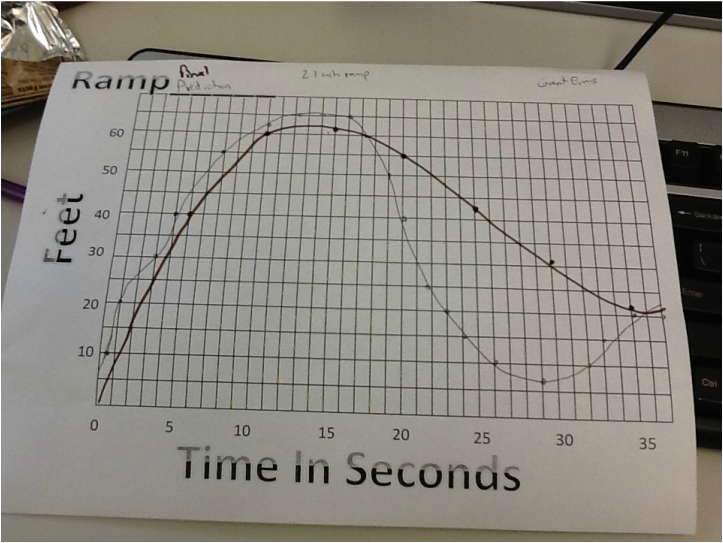
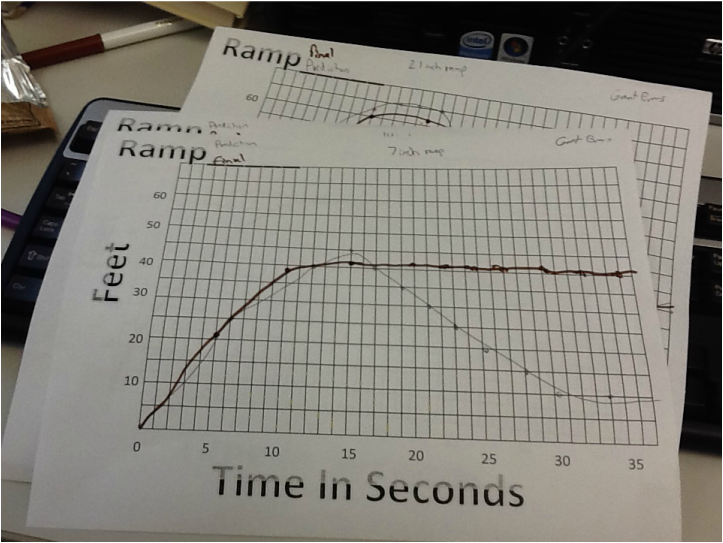
A. 2 of the 3 predictions I made were very close to the actual graph. The 7 inch ramp graph was close up until the tipping point of the graph. My prediction graph had the points move down to represent the skateboard move back towards the ramp, when in actuality, the skateboard stopped. The reasoning behind the prediction graphs was simple. I assumed that the skateboard would move away from the ramp at different speeds, depending on the angle of the ramp. So the higher the angle on the ramp, the steeper the graph on my predictions.
B. The zeros represent the skateboard on top of the ramp, not moving.
C. The zeros are all the same because the skateboard starts on top of the ramp all the time. The maxes are higher when the ramp angle is higher. On the 21 inch ramp, I thought in my prediction that the skateboard would create a new min by going back and then forwards again. The rate of acceleration is relatively the same. On the 7 inch ramp, the acceleration is slightly less so than the other two.
D. When the graph is rising at its fastest, the skateboard is moving at the fastest rate of speed it will achieve. When the graph is falling at its fastest, it is moving backwards towards the ramp.
E.
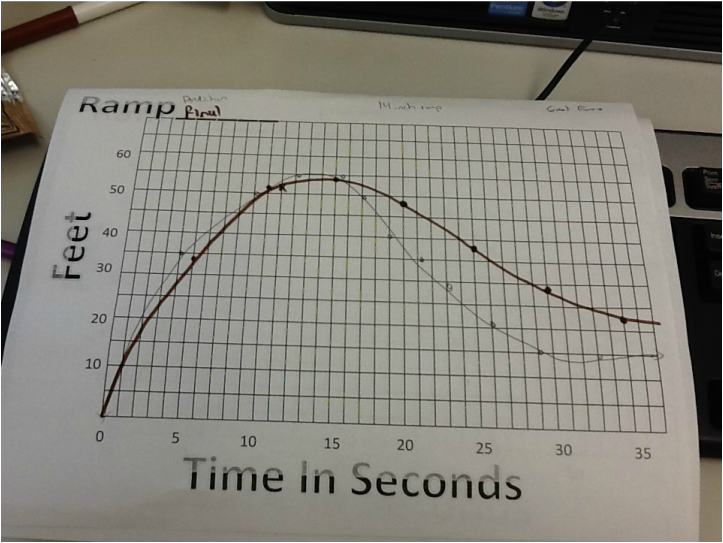
 RSS Feed