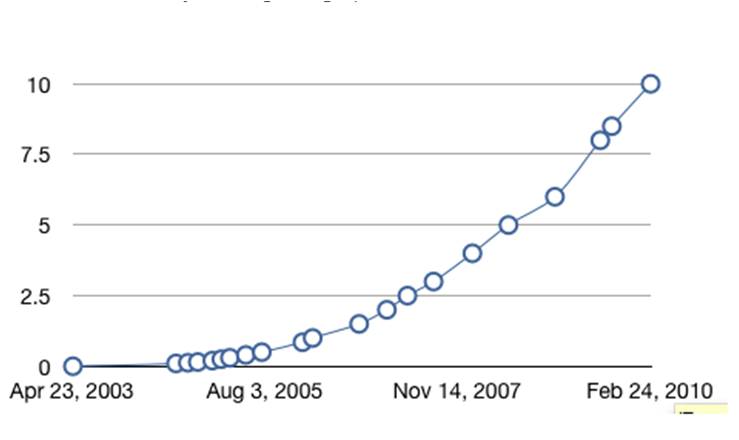

What type of function does this data appear to follow?
-The graph appears to follow an exponential growth function.
-The graph appears to follow an exponential growth function.
What is the domain of this function?
-The domain is [0, infinity)
What is the range of this function?
-The range is [0, infinity)
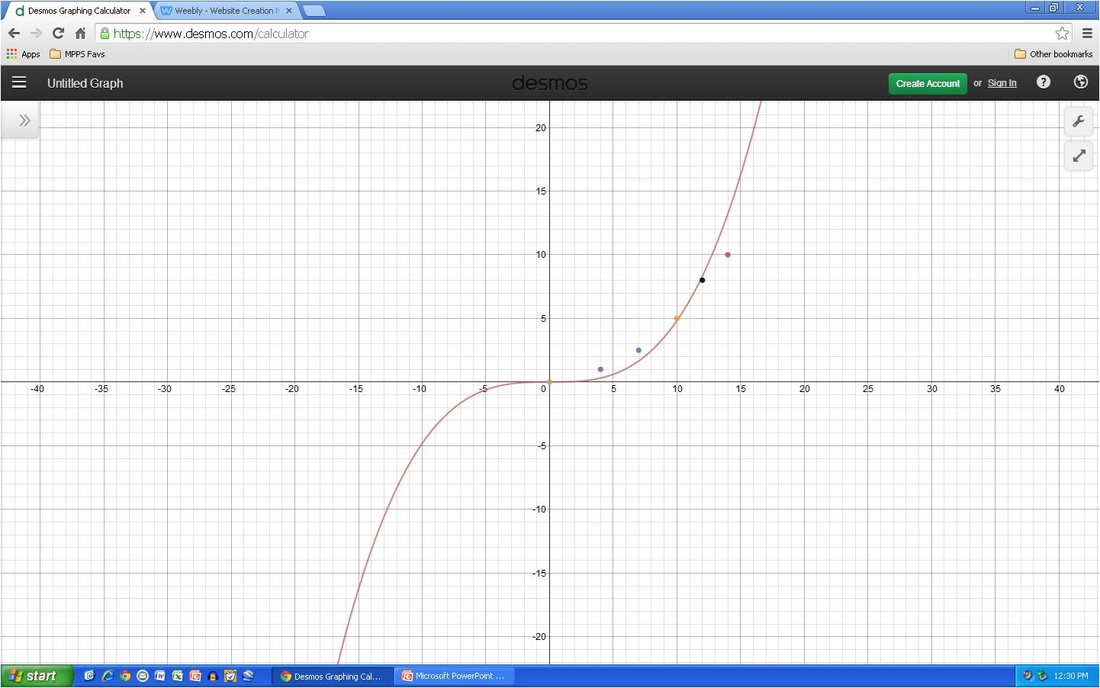
The domain is all real numbers along with the range because the graph has the potential to be any positive number and zero. We ignore the negative numbers because you can not have negative songs sold.
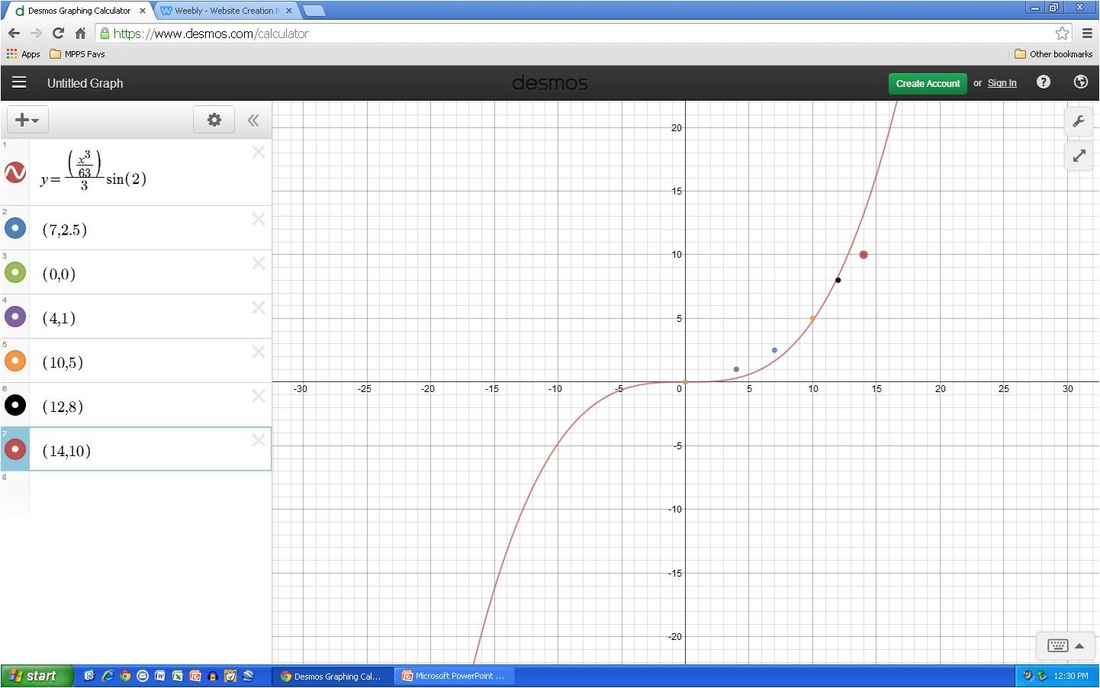
comment on the future shape of your mathematical model:
-I think that the model will need to be changed because the article stated that the amount of music being downloaded has gone down and is projected to go down because of streaming services. If the plot points go down instead of continually going up, it would no longer be an exponential function.
How does this affect your predictions of domain and range of the function?
-The domain and range stay the same because in the real world you can not go back in time or sell negative of something.
Is there a problem with trying to extend a set of data points to continuous functions? Why or why not?
-There is a problem because the continuous function is if the plot points continued upwards, which is not happening because of the loss of sales for the Apple store. Using exponential growth, we assume that the plot points, or whatever we are tracking, will forever continue to grow. This is not the case in real life. Sales go up and down.
-The domain is [0, infinity)
What is the range of this function?
-The range is [0, infinity)
The domain is all real numbers along with the range because the graph has the potential to be any positive number and zero. We ignore the negative numbers because you can not have negative songs sold.
comment on the future shape of your mathematical model:
-I think that the model will need to be changed because the article stated that the amount of music being downloaded has gone down and is projected to go down because of streaming services. If the plot points go down instead of continually going up, it would no longer be an exponential function.
How does this affect your predictions of domain and range of the function?
-The domain and range stay the same because in the real world you can not go back in time or sell negative of something.
Is there a problem with trying to extend a set of data points to continuous functions? Why or why not?
-There is a problem because the continuous function is if the plot points continued upwards, which is not happening because of the loss of sales for the Apple store. Using exponential growth, we assume that the plot points, or whatever we are tracking, will forever continue to grow. This is not the case in real life. Sales go up and down.
 RSS Feed